Explore Nifty chart, Nifty 50 stocks, Nifty analysis, Bank Nifty
Email us at custcare@freeintra.com for clarification.
Use of charts:
Normally charts are used as Technical analysis of a stock or markets. Stock charting is nothing but performing technical studies of stock.
Line charts:
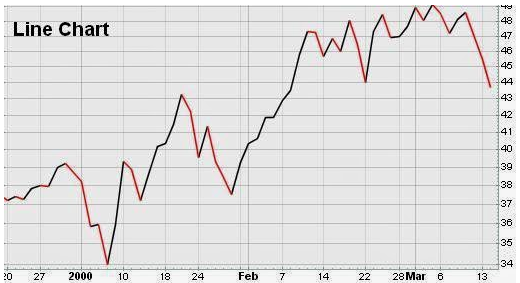
This is the basic chart which indicates stock price date wise.
A brief and basic idea can be get from this stock for near future.
Bar charts:
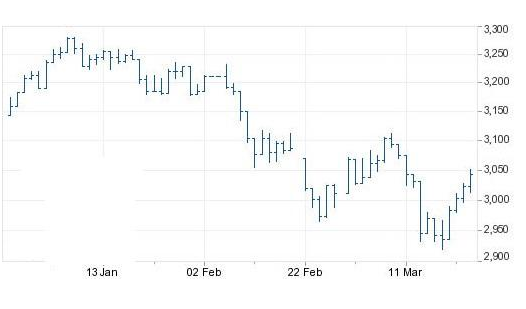
These are most commonly and popularly used charts.
It will indicate stock values like high, low and closing value of the stock on daily basis. So these charts are very useful to track stock movement for recent times.
A trader can get clear idea about stock daily swing, so
He can utilize his studies into trade more efficiently.
Candlestick charts:
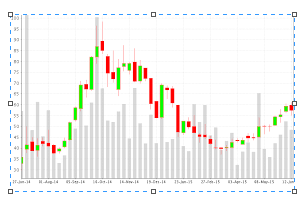
These charts originally started from Japan for stock trading.
Later it become popular all over world. In these charts information of stock with daily high, low, closing, as well as daily openings.
Point and figure charts:
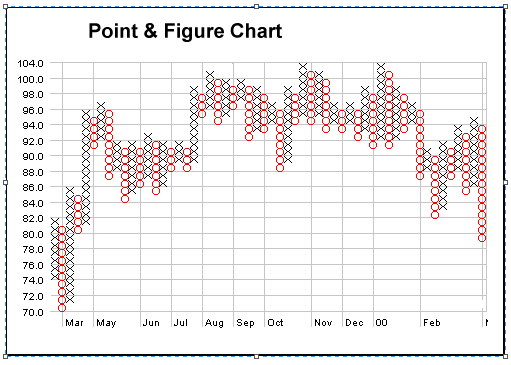
These charts are used for long-term investments.
These charts are one of the simple system to know with solid entry and exit points in stock market trading. In these charts, it tracks supply and demand on regular basis which help to decide stock trends. Point and figure charting has never been popular in technical analyst but one cant denied effectiveness of these charts!